
GcodeViewer: A React Component for Visualizing 3D Printer G-code
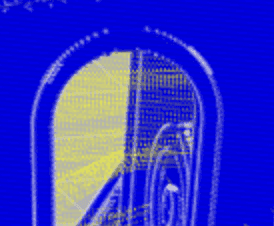
The GcodeViewer is a simple React component designed to render and interact with 3D printer G-code files. It provides a visual representation of the printing path, allowing users to inspect and analyze the G-code before actual printing.
Demo: GcodeViewer
Key Features
- 3D Visualization: Renders G-code in a 3D space, including the print bed and grid.
- Interactive Controls: Zoom, pan, and rotate the view.
- Layer-by-layer Rendering: Displays the print path with different colors for travel and extrusion moves.
- Performance Optimization: Efficient rendering of large G-code files.
Technical Overview
Core Technologies
- React: For building the user interface and managing component state.
- HTML5 Canvas: For rendering the 3D visualization.
- Styled-components: For component styling.
Key Functions and Principles
1. G-code Parsing and Rendering
The drawGcode function is the core of the visualization process. It iterates through the G-code lines, interpreting commands, and rendering them on the canvas.
This function:
- Parses G-code commands (G0, G1)
- Tracks the current position (X, Y, Z)
- Distinguishes between travel moves and extrusion
- Applies 3D transformations (rotation, scaling)
- Renders the path with appropriate styles
Detailed Analysis of the drawGcode Function
const drawGcode = useCallback(() => {
    // ... (initial part of the function)

    gcode.split('\n').forEach(line => {
        const parts = line.split(' ');
        if (parts[0] === 'G0' || parts[0] === 'G1') {
            // ... (parsing coordinates)

            const start = rotatePoint(prevX, prevY, prevZ, rotation);
            const end = rotatePoint(x, y, z, rotation);

            ctx.beginPath();
            ctx.moveTo(start.x, start.y);
            ctx.lineTo(end.x, end.y);

            if (parts[0] === 'G0' || !isExtrusion) {
                // Color for non-extrusion movement (travel)
                ctx.strokeStyle = 'rgba(255, 255, 0, 0.8)';
                ctx.lineWidth = 0.5 / scale;
                ctx.setLineDash([1 / scale, 1 / scale]);
            } else {
                // Color and shadow for extrusion
                const shadowOffset = 0.05;
                const shadowStart = rotatePoint(prevX, prevY, prevZ - shadowOffset, rotation);
                const shadowEnd = rotatePoint(x, y, z - shadowOffset, rotation);

                // Drawing the shadow
                ctx.beginPath();
                ctx.moveTo(shadowStart.x, shadowStart.y);
                ctx.lineTo(shadowEnd.x, shadowEnd.y);
                ctx.strokeStyle = 'rgba(0, 0, 100, 0.5)';
                ctx.lineWidth = (NOZZLE_WIDTH * scale) / 10;
                ctx.setLineDash([]);
                ctx.stroke();

                // Drawing the main extrusion line
                ctx.beginPath();
                ctx.moveTo(start.x, start.y);
                ctx.lineTo(end.x, end.y);
                ctx.strokeStyle = 'rgba(0, 0, 255, 0.8)';
                ctx.lineWidth = (NOZZLE_WIDTH * scale) / 10;
                ctx.setLineDash([]);
            }

            ctx.stroke();

            // Drawing a small circle at the endpoint for all movements
            ctx.beginPath();
            ctx.arc(end.x, end.y, (NOZZLE_WIDTH * scale) / 16, 0, 2 * Math.PI);
            ctx.fillStyle = 'rgba(255, 255, 255, 0.5)';
            ctx.fill();
        }
    });

    // ... (final part of the function)
}, [gcode, scale, offset, rotation, drawBedAndGrid]);
Explanation of Key Points:
-
Color for Travel Movement:
- When the movement is non-extrusion (G0 or !isExtrusion), a yellow color with transparency is used.
- The line is made thinner (0.5 / scale) and dashed ([1 / scale, 1 / scale]).
ctx.strokeStyle = 'rgba(255, 255, 0, 0.8)'; ctx.lineWidth = 0.5 / scale; ctx.setLineDash([1 / scale, 1 / scale]); -
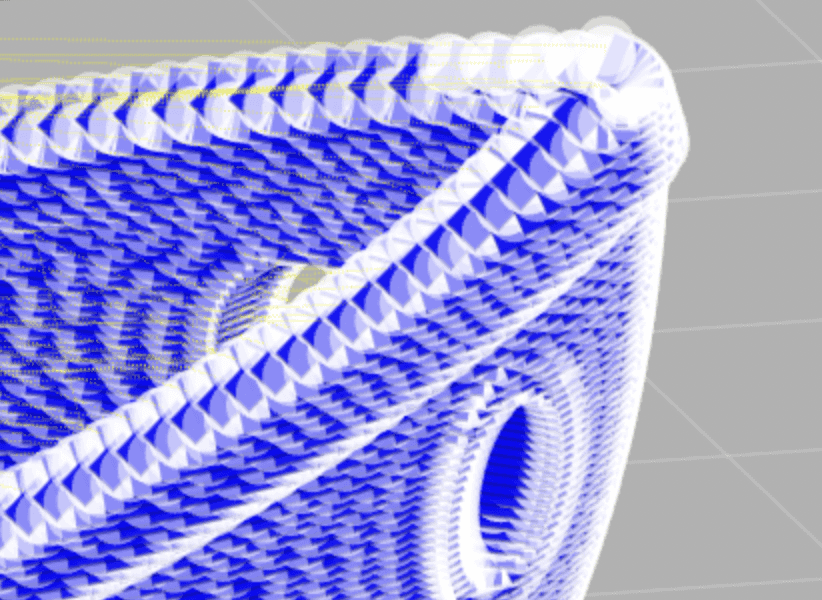
Shadow and Extrusion:
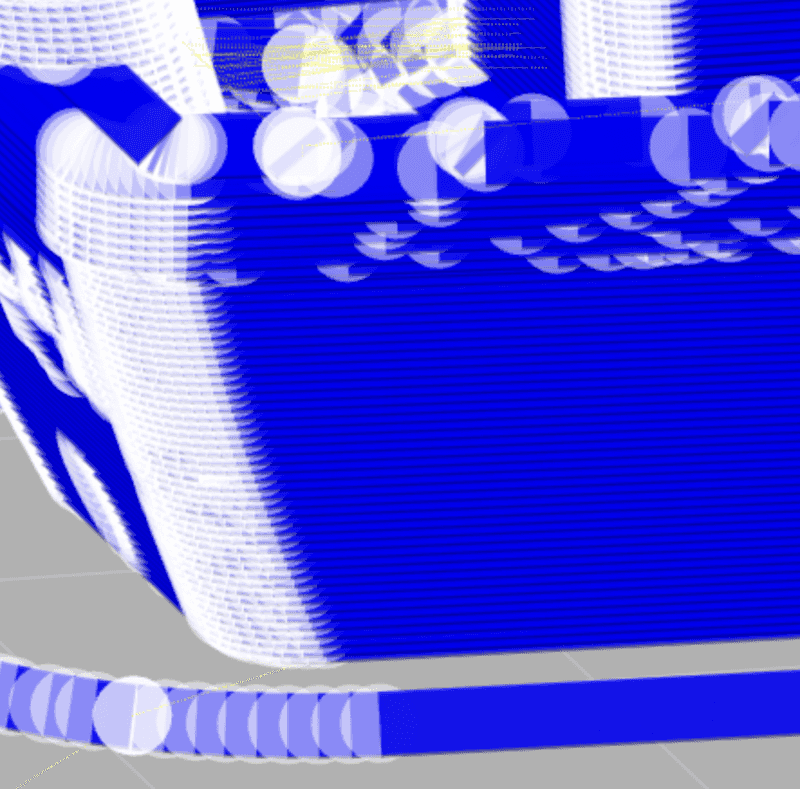
- For extrusion movements, a shadow is drawn first:
- The shadow is offset downwards by 0.05 units.
- A dark blue color with transparency is used.
- Then the main extrusion line is drawn:
- A bright blue color is used.
- The line thickness depends on the nozzle width and scale.
// Shadow ctx.strokeStyle = 'rgba(0, 0, 100, 0.5)'; // Main extrusion line ctx.strokeStyle = 'rgba(0, 0, 255, 0.8)'; ctx.lineWidth = (NOZZLE_WIDTH * scale) / 10; - For extrusion movements, a shadow is drawn first:
-
Small Circle at the Endpoint for All Movements:

- After each movement (travel or extrusion), a small white circle is drawn.
- The circle size depends on the nozzle width and scale.
- This helps visualize individual points along the path.
ctx.beginPath();
ctx.arc(end.x, end.y, (NOZZLE_WIDTH * scale) / 16, 0, 2 * Math.PI);
ctx.fillStyle = 'rgba(255, 255, 255, 0.5)';
ctx.fill();

These implementation details provide a clear visual distinction between different types of movements in the G-code, add depth to the visualization through shadows, and provide additional information about the tool path through small circles at each point. This allows users to easily interpret the visualized G-code and understand the print path.
2. 3D Transformations
The rotatePoint function applies 3D rotations to points:
const rotatePoint = (x, y, z, rotation = { x: 0, y: 0, z: 0 }) => {
   z = z + 10;  // Adjust z to account for bed height

   // Rotate around Z axis
   let x1 = x * Math.cos(rotation.z) - y * Math.sin(rotation.z);
   let y1 = x * Math.sin(rotation.z) + y * Math.cos(rotation.z);

   // Rotate around Y axis
   let x2 = x1 * Math.cos(rotation.y) + z * Math.sin(rotation.y);
   let z1 = -x1 * Math.sin(rotation.y) + z * Math.cos(rotation.y);

   // Rotate around X axis
   let y2 = y1 * Math.cos(rotation.x) - z1 * Math.sin(rotation.x);
   let z2 = y1 * Math.sin(rotation.x) + z1 * Math.cos(rotation.x);

   return { x: x2, y: y2, z: z2 };
};
This function applies rotations around the X, Y, and Z axes using matrix transformations.
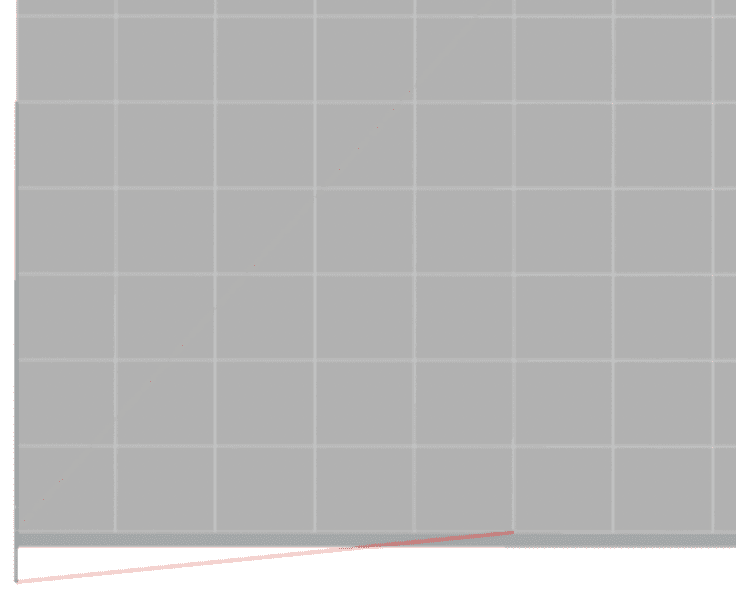
3. Print Bed Visualization
The drawBedAndGrid function renders the print bed and grid:
const drawBedAndGrid = useCallback((ctx) => {
   const { width, depth, height } = BED_DIMENSIONS;

   ctx.save();
   ctx.translate(offset.x, ctx.canvas.height - offset.y);
   ctx.scale(scale, -scale);

   // Draw bed
   ctx.fillStyle = 'rgba(100, 100, 100, 0.5)';
   const corners = [
      rotatePoint(0, 0, 0, rotation),
      rotatePoint(width, 0, 0, rotation),
      rotatePoint(width, depth, 0, rotation),
      rotatePoint(0, depth, 0, rotation),
      rotatePoint(0, 0, -height, rotation),
      rotatePoint(width, 0, -height, rotation),
      rotatePoint(width, depth, -height, rotation),
      rotatePoint(0, depth, -height, rotation)
   ];

   // Draw top face
   ctx.beginPath();
   ctx.moveTo(corners[0].x, corners[0].y);
   for (let i = 1; i < 4; i++) {
      ctx.lineTo(corners[i].x, corners[i].y);
   }
   ctx.closePath();
   ctx.fill();

   // Draw side faces
   ctx.fillStyle = 'rgba(80, 80, 80, 0.5)';
   const sideFaces = [[0, 1, 5, 4], [1, 2, 6, 5], [2, 3, 7, 6], [3, 0, 4, 7]];
   sideFaces.forEach(face => {
      ctx.beginPath();
      ctx.moveTo(corners[face[0]].x, corners[face[0]].y);
      for (let i = 1; i < face.length; i++) {
         ctx.lineTo(corners[face[i]].x, corners[face[i]].y);
      }
      ctx.closePath();
      ctx.fill();
   });

   // Draw grid
   ctx.strokeStyle = 'rgba(255, 255, 255, 0.5)';
   ctx.lineWidth = 0.5 / scale;

   // Draw vertical lines
   for (let i = 0; i <= width; i += 10) {
      let start = rotatePoint(i, 0, 0, rotation);
      let end = rotatePoint(i, depth, 0, rotation);
      ctx.beginPath();
      ctx.moveTo(start.x, start.y);
      ctx.lineTo(end.x, end.y);
      ctx.stroke();
   }

   // Draw horizontal lines
   for (let i = 0; i <= depth; i += 10) {
      let start = rotatePoint(0, i, 0, rotation);
      let end = rotatePoint(width, i, 0, rotation);
      ctx.beginPath();
      ctx.moveTo(start.x, start.y);
      ctx.lineTo(end.x, end.y);
      ctx.stroke();
   }

   // Draw axes
   ctx.strokeStyle = 'red';
   let xAxis = rotatePoint(50, 0, 0, rotation);
   ctx.beginPath();
   ctx.moveTo(0, 0);
   ctx.lineTo(xAxis.x, xAxis.y);
   ctx.stroke();

   ctx.strokeStyle = 'green';
   let yAxis = rotatePoint(0, 50, 0, rotation);
   ctx.beginPath();
   ctx.moveTo(0, 0);
   ctx.lineTo(yAxis.x, yAxis.y);
   ctx.stroke();

   ctx.strokeStyle = 'blue';
   let zAxis = rotatePoint(0, 0, 50, rotation);
   ctx.beginPath();
   ctx.moveTo(0, 0);
   ctx.lineTo(zAxis.x, zAxis.y);
   ctx.stroke();

   ctx.restore();
}, [offset, scale, rotation]);
It draws:
- The print bed surface
- Side faces of the bed
- A grid for reference
- X, Y, and Z axes
4. User Interactions
Several functions handle user interactions:
handleWheel: Zoom in/outhandleMouseDown,handleMouseMove,handleMouseUp: Pan the viewhandleRotate: Rotate the view around X, Y, or Z axis
These functions update the component's state (scale, offset, rotation), which triggers a re-render of the visualization.
State Management
The component uses React's useState hook to manage several pieces of state:
gcode: The parsed G-code contentscale: Current zoom leveloffset: Pan positionrotation: Current 3D rotationisDragging: Whether the user is currently panning
Performance Considerations
- Use of
useCallback: Key functions are memoized to prevent unnecessary re-renders. - Efficient canvas rendering: Only redraws when necessary (on state changes).
- Optimized G-code parsing: Processes G-code line by line without creating large intermediate data structures.
API and Props
The GcodeViewer component accepts a single prop:
file: A File object containing the G-code to be visualized.
Conclusion
The GcodeViewer component demonstrates advanced techniques in React development and canvas manipulation. It provides a powerful tool for 3D printing enthusiasts to visualize and validate their G-code before printing, potentially saving time and resources in the 3D printing process.